A. SNAPSHOT OF Maternal Mortality Rates (MMR) / Infant Mortality Rates (IMR) IN NTB PROVINCE
1. Infant Mortality Trend
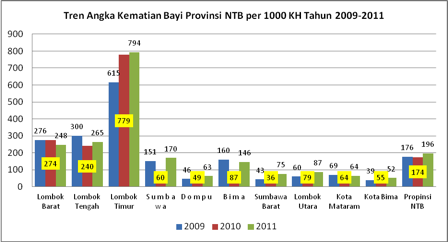
Rates of Infant Mortality (IMR) in West Nusa Tenggara (NTB) during the period of 2009-2011 have experienced an increase. In 2009, IMR in NTB province were 176/1000 live births and in 2010 this only experienced a small reduction to 174/1000 live births, however, by 2011 this rate increased again to 174/1000 live births.
The district that contributed most greatly to the escalation of infant mortality rates in NTB was East Lombok District. The total cases of infant mortality in East Lombok District in the period from 2009-2011 were 625 cases (2009), 779 cases (2010) and 794 cases (2011) respectively. During this period, the increase in total cases was quite significant, with an increase of 164 cases in 2010 and a further increase of 15 cases in the following year. Other districts that also had relatively significant contributions to infant mortality rates in NTB were Central Lombok, West Lombok, Sumbawa and Bima districts.
There has been an upward trend of infant mortality rates in Sumbawa Island, especially from the period of 2010-2011, during which there was an increase from 60 cases of infant mortality to 170 cases. Whereas, there has been a downward trend in West Lombok District, from 274 cases to 248.
2. Trend Data of Maternal Mortality Rates
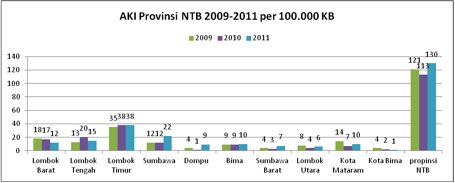
The trend of Maternal Mortality Rates (MMR) in the NTB from 2009-2011 has experienced similar fluctuations to the trend of IMR during the same period. In 2010, MMR in NTB Province experienced a reduction to 113/100,000 live births and a significant increase in 2011 to 130/100,000 live births.
The island of Lombok contributed significantly to the rates of maternal mortality in NTB Province during those three years. Three districts in Lombok had large contributions to the MMR of NTB Province, those being East Lombok, Central Lombok and West Lombok Districts. Whilst on the island of Sumbawa, Sumbawa District experienced the most significant increase in 2011, to become the district with the second highest MMR behind East Lombok.
East Lombok District possessed the highest MMR of all districts in NTB during the period of 2009-2011. In 2011, MMR in East Lombok reached as high as 38/100,000 live births. Whilst there was no increase from 2010, this figure was the highest in NTB and almost the same as the combined rates of maternal mortality for Sumbawa Island. Contrastingly, the MMR trend in Bima City was consistently downward, such that Bima had the lowest rates of maternal mortality of 10 districts/cities of NTB.
3. Trend of Births with the Assistance of Healthcare Professionals
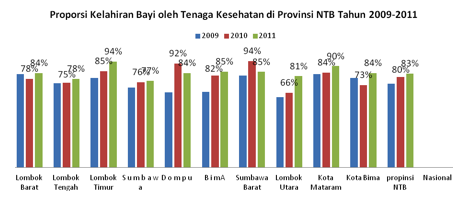
The total of births that were assisted by healthcare professionals in NTB Province during the period of 2009-2011 experienced an increase from 80% in 2010 to 83% in 2011. The average number of births with professional assistance across the districts experienced an increase. From the 10 districts/cities in NTB, only Dompu and West Sumbawa districts experienced a decrease in 2011, compared to 2010. However, in three districts, Sumbawa, Central Lombok and North Lombok, the total rate of assisted-births was below that of the provincial average.
4. Birth in Healthcare Facilities
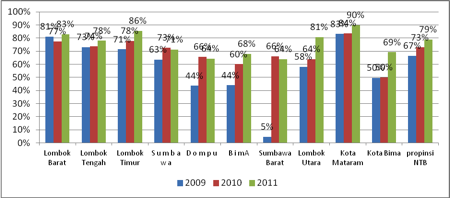
Meanwhile, the total rate of births in healthcare facilities in NTB Province experienced an increase from 67% in 2009 to 73% in 2010 and 79% in 2011. The level of births in healthcare facilities was highest in Mataram City (90%) and lowest in Dompu and West Sumbawa (64%).
5. Trend of K1 Visitations in NTB Province 2009-2011
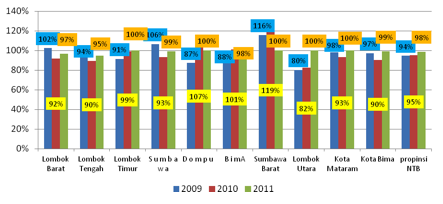
K1 visits in NTB Province experienced a relatively encouraging trend during 2009-2011. Such that in 2011, 98% of pregnant women undertook K1 visits, compared to 95% in 2010. Five districts/cities had K1 visitation rates of 100% in 2011, East Lombok, Dompu, West Sumbawa, North Lombok and Mataram City. Whereas, the districts/cities that had rates below that of the provincial average were Central Lombok and West Lombok districts.
6. Trend of K4 Visitations in NTB Province 2009-2011
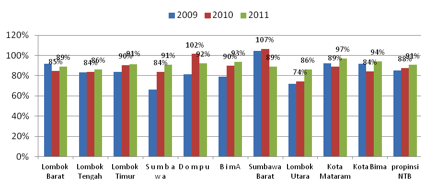
The above graphic shows that there was an increasing trend of K4 visitations in NTB Province during the period of 2009-2011. Out of all the districts/cities, only West Sumbawa experienced a reduction in the total number of K4 visitations in 2011 (89%), in the previous year, West Sumbawa had the highest rate in NTB Province, at 107%.
7. Age Trend of First Marriage in NTB Province 2009-2011
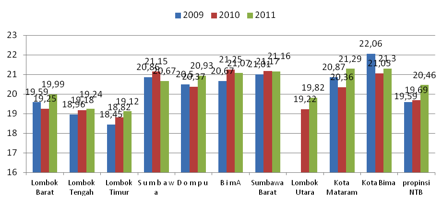
The average age of first marriage in NTB continued to experience an increase during the period of 2009-2011, to reach 20.46 years. Previously, in 2010, the average age for a first-time marriage was 19.7 years. For the majority of districts/cities in NTB, there was a fluctuating trend in average age. Whilst, in East Lombok and Central Lombok, the average age of first marriage increased with each year. In 2009, the average age in East Lombok District was 18.5 years, a figure that had increased to 19.1 years by 2011.
The average age of a first marriage in the districts of Lombok was below that of the provincial average, at between 19.12 and 19.99 years. The only exception was Mataram City, with an average age of 21.29 years. In contrast, the average age in every district/city on Sumbawa Island was above the provincial average for a first marriage. This illustrates that early marriage in Lombok is still prevalent.
8. Status of Infant Nutrition in NTB Province 2009-2011
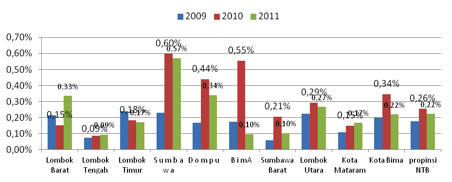
The average condition of infant nutrition in NTB in 2011 was better when compared to the previous year. This trend of improvement in nutrition status occurred in most districts/cities in NTB, excluding West Lombok, Mataram and Central Lombok. The above graphic also shows that the highest poor nutrition status occurred in Sumbawa District with a figure of 0.57%, although this was an improvement on the previous year. At the same time, an increase in cases of poor nutrition occurred in West Lombok District, from 0.15% to 0.33%.
Contrastingly, in 2010, the status of poor nutrition in Sumbawa Island was extremely worrying with high occurrences of poor nutrition cases. In Sumbawa District approximately 0.60% of babies suffered from poor nutrition, the highest rate in NTB Province for that year. This figure reduced in 2011, however, not significantly and the district remains the largest contributor to poor infant nutrition rates in NTB Province.
Bima District was quite successful in improving the status of infant nutrition, having one of the best statuses in 2011. In 2010, the status of infant nutrition in Bima was the second worse behind Sumbawa District. However, this was successfully reduced to 0.10% by the following year.
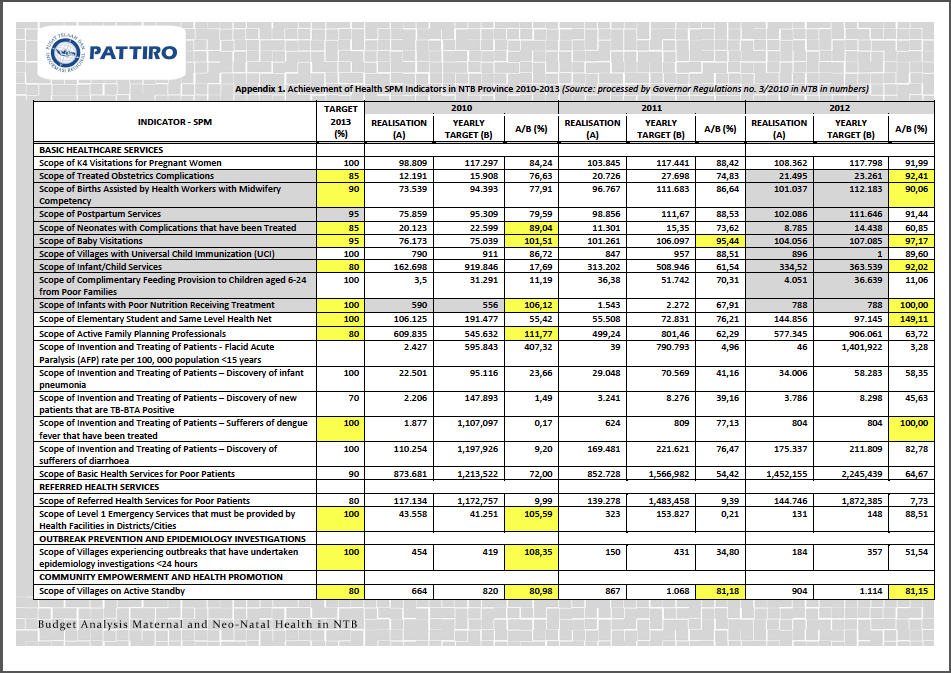
- Based on West Nusa Tenggara Gubernatorial Regulation No. 3, 2010 on minimum service standards (SPM) for the healthcare sector, the West Nusa Tenggara Government has 4 service coverage groups, that is (1) Basic Health Services, (2) Referred Health Services, (3) Outbreak Prevention and Epidemiology Investigations, (4) Health Promotion and Community Empowerment.
- In 2010, basic service targets were achieved in only 4 service scopes, the Scope of Neonates with Complications that were Treated, the Scope of Infant Visitations, the Scope of Infants with Poor Nutrition Receiving Treatment, and the Scope of Active Family Planning Participants. In 2011, there was not one basic service scope that could be achieved.
- And from 2009-2012, the achievement of basic health service SPM indicator developed in only 7 basic service scopes, those being the Scope of Obstetrics Compilations that were Handled, the Scope of Births Assisted by Health Workers with Midwifery Competency, the Scope of Baby Visitations, the Scope of Infant Services, the Scope of Infants Suffering from Poor Nutrition Receiving Treatment, the Scope of Elementary Student and Same Level Health Net, and the Scope of the Discovery and Treating of Disease Sufferers – Dengue Sufferers that have been Treated. And from 2009-2012 11 basic service scopes were unable to be achieved.
- Out of the referred service SPM indicators, only Emergency Services could be achieved, whilst Referred Health services for Poor Patients was not achieved.
- From the 22 health SPM indicator scopes for NTB, from within the Basic Health Services, Referred Health Services, the Outbreak Prevention and Epidemiology Investigations as well as Health Promotion and Community Empowerment, only 12 targets were achieved, the worst performance was within basic services, with only 7 from 18 health scopes being achieved.
B. ANALYSIS OF MATERNAL AND CHILD HEALTH (MCH) PROGRAM BUDGET IN NTB PROVINCE
1. MCH Expenditure and Health Expenditure adjusted to NTB Province CPI
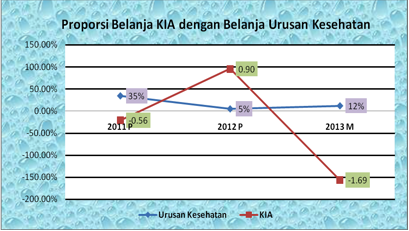
Table of health and MCH expenditure adjusted to the consumer price index (CPI)
|
Expenditure |
2010 |
2011 |
2012 |
2013 |
| Health |
136,790,207,169 |
196,571,957,146 |
199,713,775,639 |
224,114,756,994 |
| MCH |
1,347,526,486 |
812,641,906 |
8,056,379,019 |
2,952,409,954 |
The real growth of MCH and health expenditure in NTB Province in the last three years has fluctuated. Since 2011, the health real expenditure was up 35% to approximately 196 billion, up from the 2010 figure of 136 billion. In 2012, the increase was only 5% (-30%) to 199 billion, with a 12% increase to 224 billion in 2013.
Whilst the growth trend of MCH expenditure since 2011 has experienced a reduction of 534 million from 2010 or a growth percentage of -0.56%. In 2012, the growth increased by 7.2 billion to reach 8.06 billion or an increase of 0.9%, in 2013, there was a reduction of 5.1 billion to become 2.95 billion or approximately -1.69%. This health budget expenditure is outside of province to district transfers expenditure through financial bureaus in the form of financial assistance expenditure for districts/cities. Observing the MCH expenditure growth trend for 2011-2013, there is an indication that the MCH sector was not a priority for the provincial government during that period.
2. Agency Expenditure related to health and MCH
Table : Distribution of health expenditure and ratio of health expenditure
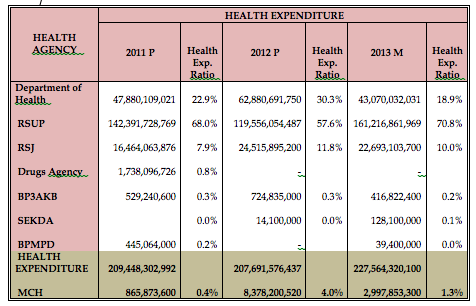
The allocation of health expenditure budgets managed by various technical agencies has experienced fluctuations in the last three years. Health expenditure in NTB has not just been managed by specific health agencies, such as the Department of Health, local public hospitals, mental health hospitals and drugs agencies, but also by other agencies such as the Body for Women’s Empowerment, Child Protection and Family Planning (BP3AKB) and the Body for Community Empowerment and Village Governance (BPMPD).
The above table shows that from 2011 to 2013, the public hospital managed the largest budget compared with the other government agencies. However, the size of this budget fluctuated with each year. In 2011, this allocation was 142 billion or approximately 68% of the total health expenditure. In 2012, this reduced to 119 billion or 57.6% and increased again in 2013 to 161 billion or 70.8% of total health expenditure. The budget allocated for the provincial general hospital was mostly designated for the improvement of quality of health services managed through the Body of Public Services system, not specifically for Maternal and Child Health (MCH).
The second largest allocation was to the Department of Health, which managed a budget in the years of 2011-2013 of between 43 and 67 billion or 18.9-30.2% of the total health expenditure. The budget managed by the Department of Health for MCH was more greatly directed towards preventative programs such as counseling and treatment activities for pregnant women, as well as the provision of vitamins and food supplements
The third largest was managed by the mental health hospitals, an allocation of between 7.9% and 11.8%. On the other hand, the Drugs Agency, BP3AKB, Sekda and BPMPD were only allocated a budget of less that 0.3% of total health expenditure. The budget for BP3AKB, SEKDA and BPMPD was allocated for maternal and child health (MCH), through activities such as family planning, the facilitation of MCH services (BP3KB), volunteer incentives (SEKDA), the revitalization of integrated service posts and integrated evaluation studies (BPMPD). The only exception is the drugs agency, which was only allocated a budget in 2011 of 1.7 billion, and no budget in 2012 and 2013.
3. Comparison of Health and MCH with GRDP
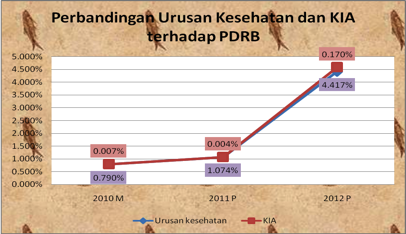
The NTB provincial government has not considered health issues as a regional priority for the improvement of local economic productivity. In 2010, health expenditure only contributed to 0.79% of GRDP (Gross Regional Domestic Product). This is despite the fact that community productivity will increase with good of community health. However, in 2011 and 2012, the contribution of health expenditure to the GRDP did experience an increase, mainly in 2012, with an increase of 4.42% and 0.17% in MCH expenditure.
4. Comparison of Infrastructure, Education and Health Expenditure
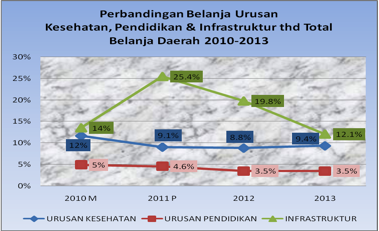
The proportion of health expenditure in NTB is not yet in line with the mandate of the Health Act that demands local government to allocate a health budget of 10% of the total local budget (APBD), excluding wages. The proportion of health expenditure in total local expenditure for 2010-2013 was on average approximately 9.7%, including public servant wages. The percentage of health expenditure was less than infrastructure expenditure with an average allocation of 17.7%.
5. Per Capita Budgetary Allocation for Pregnant Women and Children
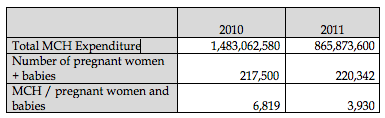
When MCH expenditure for 2010 and 2010 is viewed on a per capita basis, the allocation for pregnant women and babies amounted to only Rp 6,819 in 2010 and Rp 3,930 in 2011. These rates are miniscule when compared to the provincial budget for local health insurance (jamkesda), at 300,000 per person/year.
CONCLUSION
- The limited allocation of budget for MCH has had an effect on the size of the increase of MMR/IMR as well as the limited achievement of SPMs in NTB.
- From 32 variables in health-related SPMs, only 9 reached the targets that have been set out according to Gubernatorial Regulation No. 3, 2010.
- The highest MMR and IMR occurred in East Lombok, Central Lombok, North Lombok, Dompu and Bima City;
- A factor that influenced the size of MMR/IMR in NTB included:
The age of first marriage was between 18 – 22 years. - MCH has not yet become a priority in NTB Province; this can be seen from the limited contribution of health expenditure to the GRDP and limited per capita allocation of MCH budget.
To download this analysis, click the link below.